
How to Find What Is Actually Broken in Your Sales Funnel

I hope you enjoy reading this blog post. If you want my team to just do your marketing for you, click here.
Author: Jeremy Haynes | Published October 27, 2026
Earnings Disclaimer: You have a .1% probability of hitting million-dollar months according to the US Bureau of Labor Statistics. As stated by law, we cannot and do not make any guarantees about your own ability to get results or earn any money with our ideas, information, programs, or strategies. We don’t know you, and your results in life are up to you. We’re here to help by giving you our greatest strategies to move you forward, faster. However, nothing on this page or any of our websites or emails is a promise or guarantee of future earnings. Any financial numbers referenced here, or on any of our sites or emails, are simply estimates or projections or past results, and should not be considered exact, actual, or as a promise of potential earnings – all numbers are illustrative only.
A funnel bottleneck analysis should tell you where to put your attention next. When a webinar or call funnel underperforms, I want to see the numbers before hearing which page somebody wants to rebuild. The biggest opportunity may be a step you have barely looked at. Start with the business result, work through the stages that produce it, and find the improvement worth making first.
I see operators do this backward. They know how to write ads, so they write more ads. They feel comfortable training salespeople, so the next answer is another sales meeting.
Meanwhile, the funnel may be losing people somewhere entirely different. Being good at fixing one part of the business does not make that part the current constraint.
Already making money? See what it takes to make a lot more.
Start With the Result the Funnel Is Producing
I start with return on ad spend, cash collected per booked call, and net profit margin. Those numbers give me a reason to investigate the steps underneath them.
Return on ad spend tells you how much attributed revenue or cash comes back relative to advertising spend, depending on what your report counts. Be clear about which one you are using. Net profit margin also includes costs that an advertising return leaves out.
Cash collected per booked call connects a sales calendar to the money coming back into the business. A full calendar can look impressive while producing very little. If the business result is weak, I want to know what is happening between the first impression and the collected payment.
That is the hierarchy. A lower-level statistic earns attention because it helps explain a larger one. You do not need to treat every available number as equally urgent.
The info-business bottleneck example shows how an operator can track plenty of numbers and still work on the wrong one. Having the report and using it to choose the next action are separate skills.
Follow the Webinar From the Ad to the Payment
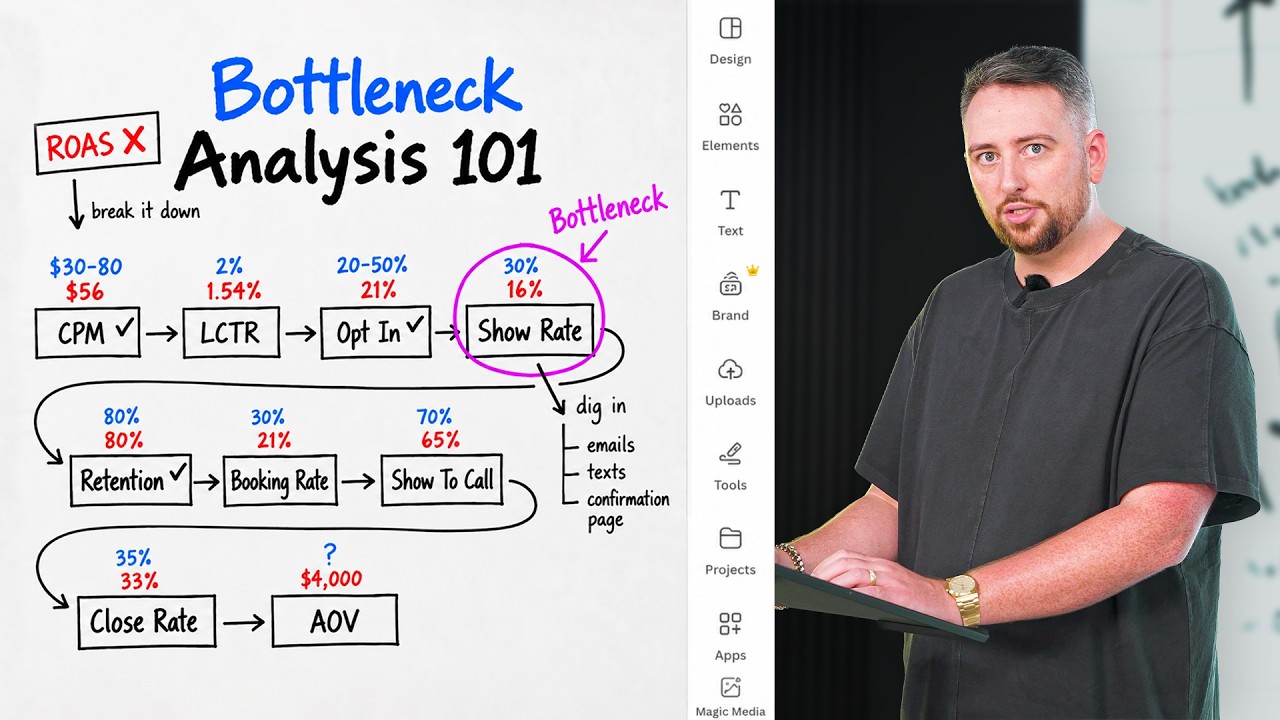
A webinar funnel needs a connected view of acquisition, attendance, the pitch, and the sales process. I work through the stages in the order the prospect experiences them.
CPM. What it costs to buy a thousand impressions.
Link click-through rate. The share of impressions producing a link click, rather than every kind of engagement.
Opt-in rate. How many page visitors register.
Webinar show rate. How many registrants attend.
Retention to the pitch. How much of the audience stays long enough to hear the offer.
Booking rate. How many people present for the pitch book a call.
Call show rate. How many booked prospects attend the sales conversation.
Close rate and average order value. How many conversations become purchases and what those purchases are worth.
Keep the denominators straight. Booking rate among the people who heard the pitch answers a different question from bookings divided by everybody who registered. If you blend the stages, a weak attendance problem can look like a weak pitch.
I also look at peak concurrent attendance against attendance at the pitch. That tells me whether I kept the audience I had. Registration alone cannot answer that.
Google Analytics funnel explorations can show movement through defined steps. The events, sequence, and entry rules still need to match the path you mean to measure. A useful-looking chart can describe the wrong journey if you configure it that way.
Look for the Improvement With Room to Matter
I compare how far each statistic could realistically move, how much work that would take, and what it would change downstream. A small gap from a target does not automatically deserve the next week of your life.
Here is the illustrative comparison I use. A webinar show rate moving from 16% to 32% would double attendance from the same registration pool. That is arithmetic, not a promise that a reminder sequence will produce that improvement.
Compare that opportunity with nudging a statistic that is already close to where you want it. Both can improve. They are unlikely to have the same effect or require the same effort.
The rest of the funnel still matters. More attendees only become more sales if the later stages can handle them and keep converting. The point is to find the step with substantial room to improve, then check what would actually be required to improve it.
I use working benchmarks to spot questions worth asking. Audience, offer, traffic source, and funnel type affect what is realistic. A benchmark helps start an investigation; it does not establish that your business is broken because a number differs.
Your Favorite Skill Can Hide the Actual Constraint
The next job belongs to the weak stage, even when you do not yet know how to fix it. Otherwise, the analysis becomes an excuse to keep doing familiar work.
You might have a much larger opportunity in webinar attendance than in ad click-through rate. If you know ads and have never improved attendance, the temptation is obvious. You can spend the day making new creatives and feel productive.
You still have the attendance problem tomorrow.
Learn the missing skill, get appropriate help, or use the evidence to work through it. Do not quietly substitute the problem you would rather solve. The relationship between bottlenecks and cost per call is why this matters beyond an individual percentage.
I teach these connected marketing decisions in Master Internet Marketing, my 7-week live comprehensive training. You need to understand how the stages affect each other before deciding which skill deserves your attention next.
Results are not typical. Your results will vary and depend entirely on your individual capacity, business experience, expertise, and level of desire. There are no guarantees concerning the level of success you may experience. The testimonials and examples used are not intended to represent or guarantee that anyone will achieve the same or similar results. We don’t believe in get-rich-quick programs. We believe in hard work, adding value and serving others. As stated by law, we can not and do not make any guarantees about your own ability to get results or earn any money with our information, courses, programs, or strategies.
Only Drill Into Details That Explain the Weak Stage
Once a main statistic points to a problem, inspect the smaller behaviors that could explain it. That keeps the investigation useful instead of turning it into an endless dashboard tour.
If the opt-in rate is weak, look at what happens on the page. Are visitors starting the video, staying with it, or leaving before they reach the next step? Is the page delivering what the ad led them to expect?
If link click-through rate is weak, look at the ad itself. The opening, the point where viewers leave, and the relationship between the message and the destination become relevant. You have a specific question for those details to answer.
Tools such as Hotjar can help you observe page behavior. Session replays and heatmaps show activity such as navigation, clicks, and scrolling. Use that activity to investigate what happened, then check your interpretation instead of assuming a replay tells you what a person was thinking.
I would not make every one of those measurements the first thing on an operator’s report. Keep the main stages visible. Open up the detail where the main stages tell you to look.
Check the Follow-Up Prospects Actually Receive
A weak show rate calls for inspecting the real messages and experience between registration and attendance. Asking whether reminders exist is not enough.
An operator told me he was already doing the follow-up work. When I looked at the actual emails and texts, the messages mostly asked people to give him their time. They did very little to make attending valuable to the person receiving them.
That changes the conversation. I can work with an actual message that fails to give someone a reason to show up. I cannot do much with a broad assurance that the system is already handled.
Go through the registration yourself. Check whether the calendar invitation arrives, whether the links work, and what the confirmation page teaches. Read the setter’s actual outreach rather than relying on a description of it.
Delivery belongs in that check too. Gmail’s sender guidelines explain authentication and other requirements affecting delivery. Sending a message does not establish that somebody received it in their inbox or had a useful reason to open it.
The education on the confirmation page is another piece of that experience. Check whether people can consume it and understand why the upcoming conversation deserves their attention.
People Leaving Before the Pitch Need a Different Fix
Retention and booking need different questions. People leaving before the offer require a different investigation from people hearing the offer and choosing not to book.
To assess retention, I want the presentation, transcript, attendance pattern, and chat. I also need to understand the intended buyer. Then I can look at what the audience was promised and what they actually sat through.
For booking, I want to see the webinar pitch and the transition into the next step. Did people understand what they could buy, why it applies to them, and what the call is for? A registration page cannot answer those questions for a pitch the person has already heard.
An operator I worked with used AI to review her webinar materials and make changes to the presentation. The useful lesson is the input she provided. A transcript and the real business context give the tool something concrete to assess.
You can ask AI to help examine a deck or revise slides. Review the proposed changes against what you actually sell. A confident recommendation still needs to be checked before it goes in front of buyers.
Call Funnels Need Their Own Stage-by-Stage View
A call funnel starts with the same acquisition questions, then follows the actual sales process. Do not borrow a webinar report and assume it describes the path.
I start with CPM, link click-through rate, and the share of page visitors who become qualified booked calls. After that, the sales process determines what belongs in the report.
Sales process | Stages after the qualified booking |
|---|---|
One-call close | Call attendance, close rate, average order value. |
Two-call close | First-call attendance, booking the second call, second-call attendance, close rate, average order value. |
A combined close rate can hide the handoff between calls. If prospects attend the first conversation but never schedule the second, that is a problem worth seeing separately. If they schedule and then miss it, look at that gap instead.
I prefer the webinar to do enough educating that the sales team can close in the next conversation. Adding another call after a full webinar adds another place to lose someone. If your process does need that call, measure it honestly.
Page visits turning into qualified bookings are often worth investigating in a call funnel. That is something I look for, not a conclusion I make before seeing the numbers.
Keep the Friction That Qualifies the Right Buyer
Some friction is deliberate because the business needs suitable prospects. Removing it can improve a surface conversion rate while making the sales calendar less useful.
An application may ask questions that help establish fit. If you remove those questions to get more bookings, check who starts booking. The new number might describe an easier form rather than a better acquisition system.
Look at qualified bookings, attendance, sales, and collected money together. You want a change that helps the business, not a report that improves because you changed what counts.
You can use the webinar calculator or VSL calculator to explore how stage assumptions interact. Those are projections based on inputs. They cannot tell you that a proposed improvement will happen.
7 weeks. Real frameworks. Covering copywriting, funnels, paid ads, and conversion systems.
Give AI the Numbers Before Asking It for a Fix
Useful AI assistance starts with the funnel numbers and continues with questions about the weak stage. A generic request to improve the business skips the work that makes the answer relevant.
I built a free Jeremy AI bottleneck analysis around that process. First, you provide the statistics. Then you answer questions about the area the analysis identifies, so the recommendations can use more than a single percentage.
The answers matter. If the issue is attendance, provide the confirmation experience and the follow-up details. If the issue is the presentation, provide the materials and explain the intended buyer.
A written analysis and an agent carrying out changes are different things. Review the recommendation, decide what should change, and give any tool only the access needed for work you have chosen to do.
These are the kinds of decisions operators can bring into my Inner Circle, a peer mastermind. I want to see where the numbers point and what is really happening at that step. Once you know that, you can stop guessing which part of the funnel needs your attention.
Results are not typical. Your results will vary and depend entirely on your individual capacity, business experience, expertise, and level of desire. There are no guarantees concerning the level of success you may experience. The testimonials and examples used are not intended to represent or guarantee that anyone will achieve the same or similar results. We don’t believe in get-rich-quick programs. We believe in hard work, adding value and serving others. As stated by law, we can not and do not make any guarantees about your own ability to get results or earn any money with our information, courses, programs, or strategies.
Get my content first on Google
Add jeremyhaynes.com as a preferred source and Google shows my articles more prominently in your search results, including AI Overviews and AI Mode.


Jeremy Haynes
Owner and CEO of Megalodon Marketing
Jeremy Haynes is the founder of Megalodon Marketing. He is considered one of the top digital marketers and has the results to back it up.