How to Reduce Cost Per Call for High Ticket Offers Using Bottleneck Analysis

I hope you enjoy reading this blog post. If you want my team to just do your marketing for you, click here.
Author: Jeremy Haynes | Published November 14, 2025
Earnings Disclaimer: You have a .1% probability of hitting million-dollar months according to the US Bureau of Labor Statistics. As stated by law, we can not and do not make any guarantees about your own ability to get results or earn any money with our ideas, information, programs, or strategies. We don’t know you, and besides, your results in life are up to you. We’re here to help by giving you our greatest strategies to move you forward, faster. However, nothing on this page or any of our websites or emails is a promise or guarantee of future earnings. Any financial numbers referenced here, or on any of our sites or emails, are simply estimates or projections or past results, and should not be considered exact, actual, or as a promise of potential earnings – all numbers are illustrative only.
On your journey to million-dollar months, you’re going to have to learn how to drive down your cost per call. It will absolutely destroy your return on ad spend, prevent scale, make it so you get all scared, shaky, and uncertain as you’re trying to push your numbers up.
And we got to learn how to address that as we’re continuing to pump more dollars into Mr. Zuckerberg’s pockets and the team over at Google and whatever other ad channel you may be using.
These lessons are tried and true. We are going to go through some of the top best practices right here in depth on how to drive down cost per call at scale.
At scale. Because that’s what we talk about around here is hitting million dollar months.
We don’t make any income claims. You have a zero point one percent probability according to the US Bureau of Labor Statistics to even hit ten million dollars a year, let alone the big million dollar months.
So again, no income claims, just taking all the been there, done that lessons from helping businesses hit million dollar months and handing them down to you right here.
So welcome in if you’re new. And of course, if you’re already following along, welcome back. Got an absolute banger for you here today.
If your business is already generating $100k+ per month, My Inner Circle is where you break through to the next level. Inside, I’ll help you identify and solve the bottlenecks holding you back so you can scale faster and with more clarity.
So without further ado, let’s dive in.
How to Think Like a Doctor to Diagnose Marketing Bottlenecks in Your Funnel
One of the very first things that we have to do is we have to assess where a potential bottleneck occurs. We have to think like doctors.
Let me give you a perfect example of this. Just the other day, your boy wakes up and has some kind of crazy ache on the ball of my right big foot. I’m like, “What is going on down there?” I have no clue.
So here’s what I do. I call over a doctor. I call over my chiropractor as well. I get an X-ray to come to my house and I get an ultrasound to come to my house.
And these four people, they collude with one another in an attempt to figure out what’s going on with Big Jeremy’s big right big toe ball.
You get what I’m saying? The ball of my foot.
So moral of the story is the X-ray comes back and shows something that might be a stress fracture, maybe not. My chiropractor ends up, he is the one that ends up finding the problem. Shout out to Dr. Ron.
There’s this tendon that runs down the inside of your leg. It’s called the FHL tendon. And this thing connects right to the ball of your big foot, but it runs down the inside of your leg.
How did he find it, you ask? Well, he absolutely took his hand and just dug into it on the inside of my leg. And boy, did it hurt. It hurt, as a matter of fact, far worse than what the ball of the foot did.
And that’s sometimes how pain works. There’s something that hurts, but in reality the pain is coming from somewhere else.
And that’s all doctors really do when they look at your symptoms. They first of all try to bring a bunch of data into their worldview to start making decisions with and to start making assumptions with.
From there, they list in probabilities. This could be the highest probability. These could be the lowest probabilities. And then they start to test.
Sometimes they’ll rearrange the order of when they test what based on severity.
I’ll give you a great example of this one too. The first time I ever had a migraine with aura symptoms, I thought I was having a stroke. I had no idea what was going on.
I was seeing little swirly things in my vision. I was getting numbness going from my pinky up my hand a little bit. I was trying to say the words, “I have a headache” to somebody I was on the phone with.
And instead, the words coming out of my mouth were, “I have a haircut.”
As crazy as that sounds, apparently it’s just a migraine with an aura symptom. But boy, when I went to the doctor, they didn’t treat it like that.
Just based on the description of the symptoms, right away they were like, I mean, that sounds pretty stroke-like to me. Let’s test it for that first.
So we did a CAT scan. We did an MRI. Those came back negative. There was beyond a stroke. There was this other little thing, and I’m not a doctor. I don’t remember these terms.
There’s a three letter word that started with a T, like TIA or something like that. It’s when essentially a little fleck of plaque gets lodged into one of the veins in your brain, and that could also cause symptoms like that. And that could also be quite severe and lead to stroke.
So they tested for that too. Nothing.
Ultimately a neurologist came in and he was like, “Yeah, man. You just got migraines with aura symptoms. You just got to chill out.”
And anyway, moral of the story is, without going too off track, based on the symptoms, based on the data at hand that’s then collected, you then make some assumptions and you organize those assumptions in terms of severity and just probability.
Then from there, you test those assumptions, and you kind of work your way down the list.
Marketing Bottleneck Analysis: Find the Choke Point Where Everyone Gets Stuck
So in marketing, one of the things that’s going to happen the most and it doesn’t matter whether it’s a cost per call or just a cost per result of any kind, we have to be able to assess what’s called a bottleneck.
And a bottleneck is just analyzing each individual step of our process and trying to find where the choke point is. Research shows that analyzing conversion rates at each funnel stage helps businesses identify bottlenecks and optimize their strategies, with companies that monitor each stage better identifying friction points and improving efficiency.
Where is the contraction? Where is everybody stopped? And if we opened that up, how could we get a lot more people to the other side if we did?
And that thinking, that is a fundamental way to just analyze data in general.
So typically what I’ll do is I’ll start with the most important metrics first. There’s this concept called an auxiliary metric.
I’ll give you a great example of this. In a call funnel, one of the first things I’m going to do is I’m going to look at my cost per call.
Now yes, there’s plenty of auxiliary statistics that can technically make that statistic up. As an example, CPMs, my link click-through rate, my application rate, my play rate on my video that’s on the page, the consumption of the video that’s on the page, a potential drop off point within the application itself.
But those are all kind of statistics that make up the statistic of cost per call. You see what I mean?
I have to be able to first look at the main statistics. That way I don’t have to analyze every single individual analytic that there is to analyze.
I’m going to look at the main ones that a bunch of smaller statistics make up. Then, from there if that specific statistic is the bottleneck at that point I’m going to drill down on the individual analytics and data points that make up that larger statistic.
Key Call Funnel Metrics: Cost Per Call, Show Rate, Close Rate, AOV
So in a call funnel in this example, very first thing I’m going to look at is my cost per call. And more importantly than anything else, my cost per qualified call.
From there, there are some other big statistics. I’m going to have my show rate. I’m going to have my, and again this might vary give or take whether you have a one call close or a two call close.
If I just have a one call close, I have my show rate, my close rate, my AOV.
If I have a two call close, then I have my first call show rate, my second call booking rate, my second call show rate, then I have my close rate.
So in this case, cost per call, show rate, close rate, AOV.
These are just some, again, just those higher level statistics that I can look at and kind of start off with. And then if any one of these in particular is the choke point, that’s where I’m going to drill down and do some analysis on this further and try to open it up.
Now this is where most marketers really mess up, especially at scale. At scale, this essentially becomes a game of whack-a-mole, where this choke point, this bottleneck is going to move around. It rarely ever just stays static.
So in this case in particular with how I’m framing this blog for you, I want to be clear. We’re going to treat it like the cost per call is what’s high and I’m going to give you some specific perspective on that.
But I just want to start this by making sure you understand you need to do an analysis of the entirety of your funnel.
Why Show Rate Example Shows Focus on Easiest Stat to Double or Cut Half
Because as an example, let’s say you have a twenty five percent show rate to your call and that means seventy five percent of people aren’t even showing up.
I mean, sure, you could technically reduce your cost per call in half and that would double the quantity of people that show up, that would double the revenue as a result, assuming that those other statistics hold the same.
But to be clear, it’s like, you know, if I had, let’s say, a one hundred dollar cost per call, and that’s arguably pretty good for a qualified call, and then I look at my show rate and it’s terrible.
The logic of why I’m starting off this blog teaching you about bottleneck analysis is because you need to take your attention to what’s easiest to double or easiest to reduce in half.
You see, your statistic has to be in a place where it’s reasonable to cut it in half or where it’s reasonable to double.
As an example, if I have a link click-through rate of four percent, which is insane if you run ads, how often do you see a four percent link click-through rate ad creative? Not that often, to say the least.
However, when you do, by the grace of God, you obviously want to milk the living daylights out of that specific creative.
To have the illusion that you can take that from four to eight, I mean, get out of here. That’s just an unrealistic perspective to hold. You see what I’m saying?
What Makes Up Cost Per Call, CPMs, Link, CTR, Play Rate, Application Rate
So again, bottleneck analysis is going to help you identify is the cost per call in this case what is easiest to double or is there something else that’s technically higher leverage within your process.
So again, assume that it is your cost per call. From there we have to look at what statistics technically make up that stat.
So first of all we have CPMs. What does it cost to just reach a thousand people inside of the ad platforms?
Sometimes you’re getting punished, but you’re really strong with your return on ad spend. And so you don’t really care if you’re being punished with a high CPM or one of these other statistics is kind of suffering.
This really only matters when it matters. Like again, I want to be really clear. If I have a client that’s just cranking a very consistently high return, whatever that’s self-defined to be, and they’re happy and they’re scaling, we’re going to keep pressing the gas.
We’re not going to take our attention and just be like, “Oh my gosh, we have an eighty dollar CPM. We need to cut that in half.”
We’re not going to care. We’re going to keep spending more money because we’re making a ton of money.
But anyway, again, cost per call, CPMs. We want to look at link click-through rate.
One thing that I see advertisers make is a very common mistake is when you look at click-through rates, you want to look at the unique link click-through rate.
That is the outbound click-through rate to the page that you’re actually driving the traffic to. That’s what matters the most in this situation. That’s what’s going to have the most leverage. That’s going to be indicative of whether you have a great ad creative or not.
Again, just to be clear, there’s technically some statistics that you could look at that make this up. We could look at our thumb stop percentage and all of our video analytics as a whole or if we’re running image ads, obviously we need to look at those too.
And we need to be considerate of, well, what is preventing people from clicking through? Is it the fact that people are stopping and then they’re just looking at the ad and saying, “Ah, that’s really not for me.” Or are they not stopping at all and they’re just scrolling right past it?
So things like thumb stop percentage, things like just our total consumption, our drop off rate, we’re obviously in almost all examples when we look at an ad’s view through percentage, we’re going to see a pretty significant drop at the beginning and generally you end up seeing a pretty strong retention at the end.
If you see something that just looks even worse than that, then obviously you know you have a problem.
So long story short, again, some of these statistics are made up by other statistics. You see what I’m saying? You see where I’m going with this?
Page Performance Metrics Play Rate on VSL and Application Rate Breakdown
Anyway, so once we see our CPMs, once we see our, in this case, link click-through rate, we want to move over to the page itself.
So some specific statistics that we can look at are things like play rate.
So assuming that you have a page on your call funnel that looks something like this. You have a headline, you have a video, and then you typically will have your application somewhere down here or like a button to your application.
And regardless of whether you have additional sections or not, it’s a slightly different conversation.
If you have this type of page for your call funnel, you want to look at the play rate. So the play rate in this case is how many people hit the page and actually pressed play on that video.
I saw for the first time ever from one of my inner circle members with a relatively decent amount of people, it was a couple hundred people, one hundred percent play rate. No exaggeration.
It’s the first time in my literal career of marketing that I’ve ever seen one hundred percent play rate. I thought it was an illusion. I thought it was a glitch. I even went back to the person and I said, “Can you show me that again and make sure that it’s real?”
And it was crazy.
Most play rates, I’ve had million dollar month clients that have, without exaggeration, in the teens for their play rate, which means that the total quantity of people to hit the page is in the teens, somewhere between ten and nineteen percent for the total quantity of people that are willing to press play on that video.
Generally, as a good rule of thumb, you want to be above fifty percent. Industry research on sales funnels confirms that optimizing each funnel stage significantly impacts conversion performance, with businesses that systematically analyze bottlenecks seeing measurable improvements in overall funnel efficiency.
But I just want to be clear, in the instance you’re below that, you’re still seeing strong return on ad spend, it is what it is. You have to do bottleneck analysis. You have to determine if that’s where you want to place all of your attention.
Just because something could be improved doesn’t mean that it’s worthy of you putting all of your attention on it to improve it. If there’s something else that’s easier to double or reduce in half that has more leverage and can therefore make you a ton more money. See what I’m saying?
So anyway, long story short, play rate.
Application Rate Breakdown, Drop Off Between Questions, Qualifying vs Unqualified
And then obviously we also have our application rate, which is the quantity of people that actually start the application and complete it taken against the total quantity of people that actually hit the page.
And as you can imagine, our application rate is also made up of a few statistics. In most instances, it’s just drop off rate in between our questions.
So let’s say I have a ten question application that includes four of those as first name, last name, email, phone, six things that are technical questions.
There’s in most instances the higher quantity of application questions that you have a strong probability that one of those particular questions has a large drop off percentage.
Sometimes that’s a good thing. So if you’re getting rid of a bunch of broke people and unqualified folks that are coming through your funnel and you have a financial qualifying question or whatever other qualifying questions you might have that are getting rid of those people as they answer the question the wrong way, that’s technically a good drop off percentage, not a bad drop off percentage.
Obviously, if you’re getting a lot of those types of people, need I not say that you are getting a lot of folks that are unqualified and you might have a messaging issue on the front end for who you’re bringing into the funnel in the first place.
However, without going too far down that rabbit hole to stay on topic, point I’m trying to make is application rate is obviously made up of drop off questions as well.
Which one of those particular questions might have a huge drop off percentage and again might need removed, reworded, etc.
What Really Drives Cost Per Call Stats, Not Just Creative, But Messaging Targeting
Now just to be really clear on this, every single one of these statistics, from CPMs to link click-through rate to play rate to application rate to the thumb stop percentage to the video analytics or the image analytics all the way over to the drop questions within the application itself, all of these are what dictate cost per call.
These are the analytics, the data points that can influence it. But that’s not the only thing that influences these things.
I’ll give you a good example of this. Back to my big toe situation. I remember I wake up, I’m in pain. It’s not really the big toe itself. It’s the ball of my big toe. Like the ball joint.
And I’m able to put weight on it. I’m able to walk. It just kind of hurts when I try to lift my toe up. It’s like the other one can go way up. The other one was like here. And it was quite confusing.
As I mentioned, chiropractor digs his hand into the side of my calf. Just lights it up. Very clear I need to stretch. And that was very tight. And it connected. That FHL tendon connected right at where the big toe ball joint is.
So again, there’s a very high probability that that would be the case.
However, doing some blood work and getting some initial data as well from that perspective, we were trying to look, I don’t remember the specific word. I think it starts with a U, something acid that is indicative of whether it might have been gout or not.
And it wasn’t gout to be clear. But again, blood work came back and said, okay, hey, this specific metric that could be indicative that it’s gout is not that high. So again, that has a low probability for it to be the case.
But let me be clear. Let’s say that it was high and let’s say that that did therefore increase the probability it was gout. Is the data point in itself is that influence just on its own? It’s like no.
It’s like, well, what dictates, as an example, link click-through rate? What dictates the quantity of people that might go to a page that are so well-framed, they don’t need to watch the video? They’re already ready to buy.
Like you did such a good job at getting the right type of person to the page, they’re just ready to convert once they get there.
What differentiates that type of person coming to the page? Because again, if you looked at a play rate that was low, but you already had a really good cost per call and you’re getting really good people to come through, it’s like, do you need to technically drive up the play rate?
What makes up that statistic is the point I’m attempting to make.
Why Messaging and Targeting Matter More Than Split Testing Thumbnails
It is the, in this case, messaging that drives somebody to the page. It’s who you tapped into in the first place that can also wildly influence all these statistics without really having to change anything else.
So in that example with my blood work and that specific acid that they were looking for, it’s like, well, that number is just not what it is without something that makes up the number.
In this case, I believe, and I’m not a doctor. I honestly have no idea how this works. I’m under the impression you get gout from eating a ton of steak, which I definitely do.
So anyway, long story short though, it’s like again, I don’t have gout, thank God. But that statistic is made up of how much steak, I don’t know, that I eat that dictates it.
All these statistics that we talked about, they’re not just that, that’s not just what they are. They are that statistic because of who you drove to the page, which means that messaging, targeting, these things have a huge influence over those statistics.
In addition to that, pixel conditioning. Pixel conditioning also has a tremendous influence over who is probable to convert and what your statistics up above are going to be.
These can dictate stats. You see what I mean?
Split Test Trap: Why Testing Thumbnails Fails When Attracting Wrong People
And if you don’t pay attention to this fact, you’re probably going to just look at the data and think that, okay, let me run a little split test here with a thumbnail difference. Maybe that’s going to get my overall play rate up.
Oh, let me try some completely different ad creatives here. I bet that that’s going to drive up my total statistic.
But in reality, it’s like you might just be targeting the completely wrong people. You might be using a set of messaging that’s so far off from attracting the right people in the first place.
Who, if you literally didn’t change anything else besides the messaging, just who you’re talking to, or if you have the right messaging but you’re targeting the wrong people, that in itself can cause dramatic, and I mean dramatic changes, huge fluctuations, wild fluctuations in how each one of these statistics look.
How to Apply Doctor Framework: List Bottlenecks by Probability Severity Impact
So from there, it’s like I talked to you about at the beginning of all this. When you think like a doctor and you’re doing true bottleneck analysis and you’re asking yourself, all right, remember what I talked to you about at the beginning.
I have to come up with a list of things that are probable to be wrong and choked out and a bottleneck. And I’ve got to ask myself, okay, out of all these things, which one of these things is the highest probability?
Which one of these things is the lowest probability? Which one of these things is the most severe? Which one of these things can have the most impact if it did improve?
From there, I need to go and I need to collect some data to help reinforce my thesis. Is there anything like a sub-statistic that I can look at or just some historical data I can look at that can also show me that one of these things might be the choke point I need to pay attention to?
And then how do I go about solving the choke point becomes the next question.
Do I go about solving that choke point by changing messaging, targeting? Do I focus on pixel conditioning? Do I isolate all my attention to just that one specific part of the creative where in my video analytics the drop off percentage is?
What specifically do I choose to do?
Where to Get Help Inner Circle for $100K Plus Monthly or Master Internet Marketing
And for things like that, you’re going to have to check out the information available, like joining my inner circle program if you’re above one hundred thousand a month and you want access to one-on-one mentoring and a group full of wealthy people trying to get substantially wealthier.
People ideally just like you that are high level that want to get a lot richer, that are open about getting a lot richer, sharing things that are helping getting them a lot richer and participating in a group with a leader like me, a charismatic individual that’s trying to push you, hold you accountable, and increase your standards to get there faster.
That’s really what you’re doing when you join into one of those offers. You’re buying speed.
I believe that if you’re the right type of person for that offer, you’re going to get there anyway. All you do when you invest into somebody like me is you’re just purchasing getting there faster.
That’s really the main thing that we help you do in that specific offer.
Other than that, you can also find a full week’s class from my seven week master internet marketing program where I go through bottleneck analysis, financial modeling, and a bunch of other high level lessons for no cost so I can bribe you into showing, I just want to show you how awesome that class is.
And I want to give you one of those weeks completely for free. Week one of the seven week live class. Check it out, opt in, watch it.
And either way, go out there and get richer. Check out some of my other content. There’s some other bangers that I would love to have the opportunity to show you.
And follow along if you’re not already. Get richer.
Summary: Cost Per Call Driven by Messaging Targeting Pixel Conditioning Not Just Creative
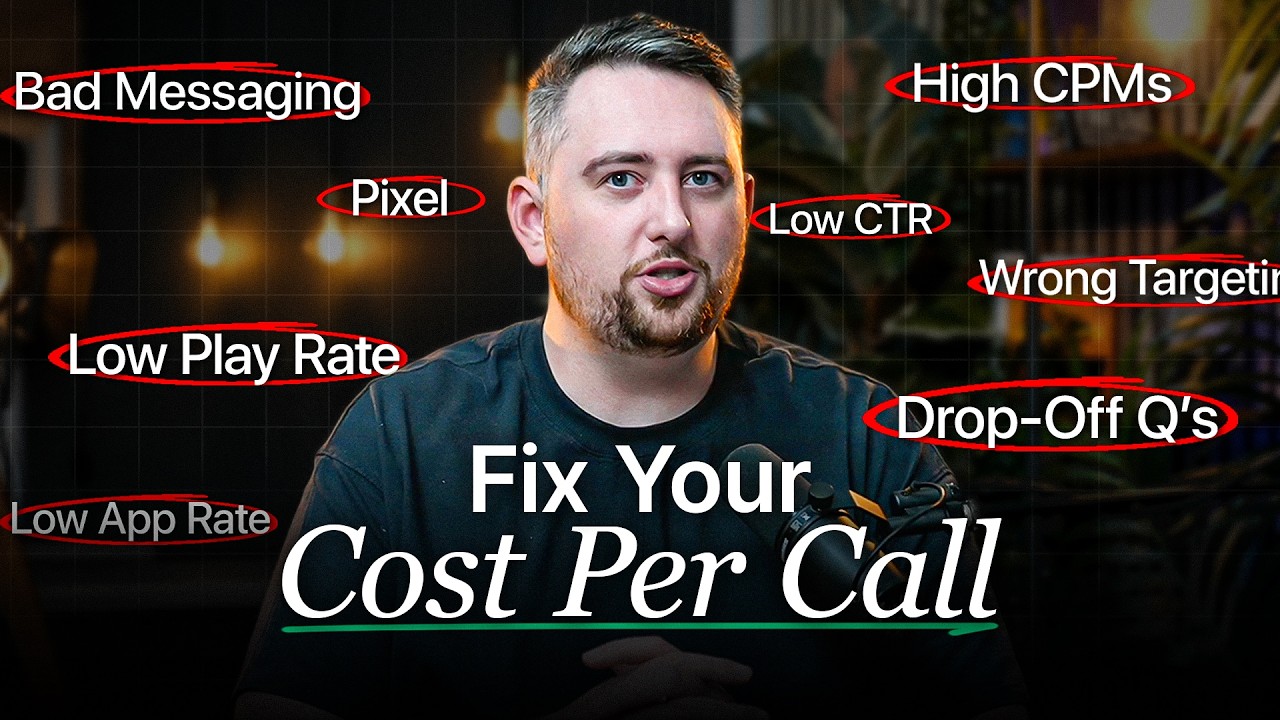
Cost per call is made up of multiple statistics. CPMs. Link click-through rate. Play rate. Application rate. Drop off questions.
But those statistics are driven by something deeper. Messaging. Targeting. Pixel conditioning.
You can split-test thumbnails all day long. You can change ad creatives. You can tweak copy. But if you’re bringing the wrong people to the page, none of that matters.
Think like a doctor. List out the probable bottlenecks. Organize them by severity and probability. Collect data. Test your thesis. Then fix the highest leverage problem first.
Not the easiest problem. Not the most obvious problem. The highest leverage problem.
That’s how you reduce cost per call while scaling to million-dollar months. Fix the right bottleneck at the right time.
Stop whack-a-mole marketing. Start systematic bottleneck analysis. That’s the difference between being stuck at six figures and scaling to seven.
Most business owners waste years figuring out what actually works. In my Master Internet Marketing program, I compress that learning curve into 7 weeks, covering copywriting, funnels, ads, and more. If you’re ready to invest $5k and get serious about your skills, apply here.
Watch the video:

Jeremy Haynes
Owner and CEO of Megalodon Marketing
Jeremy Haynes is the founder of Megalodon Marketing. He is considered one of the top digital marketers and has the results to back it up.